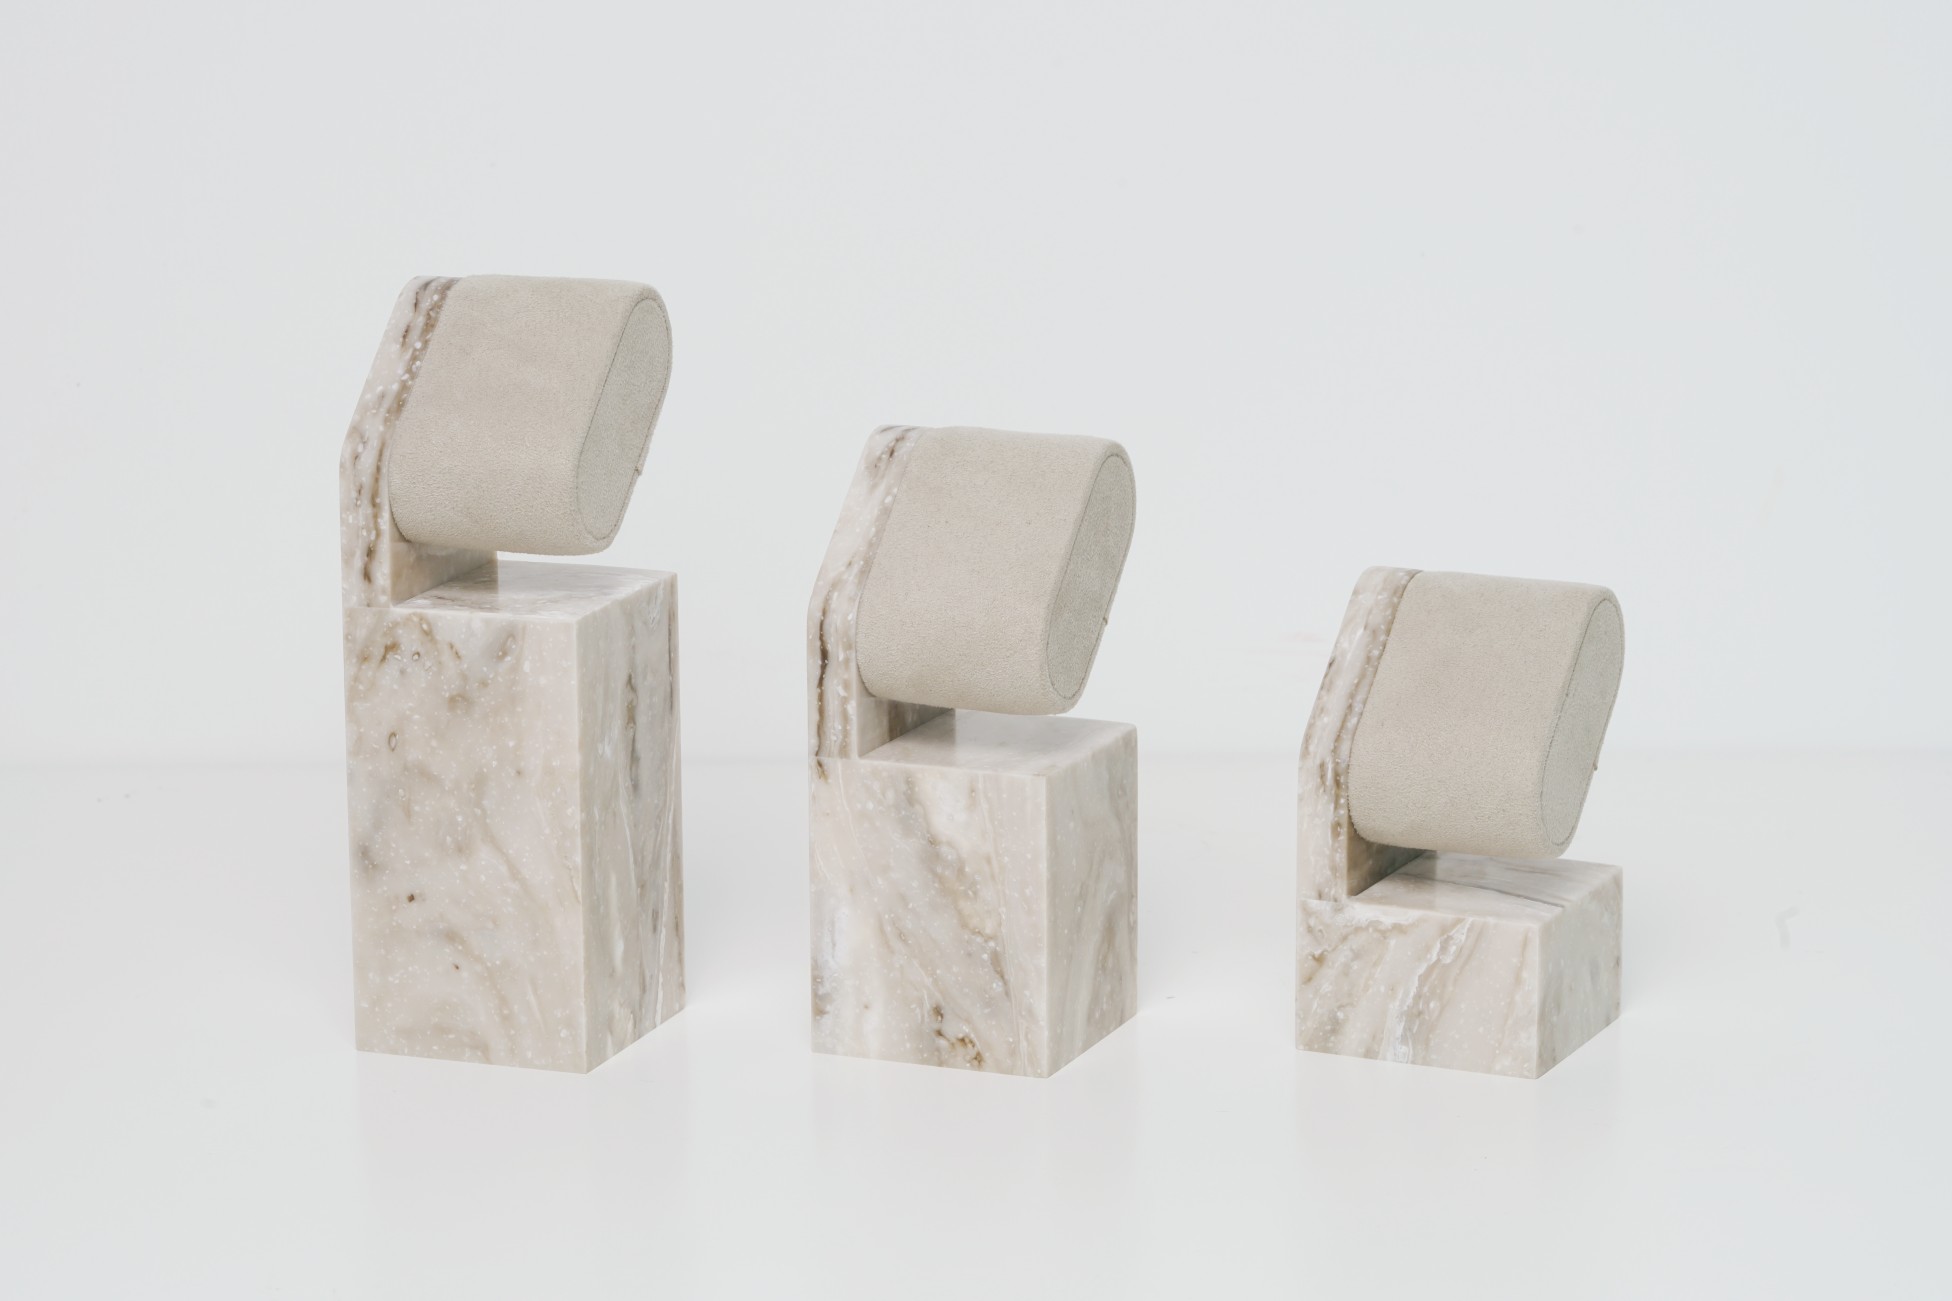
Display Performance Metrics: Sell-Through, Stock Turn, Footfall Impact

foldable POP displays

How to Measure the ROI of Your Visual Merchandising and POP Displays
By Yan Luo | Samtop Display

The ROI of a display isn’t just visual — it’s measurable. Key performance metrics like sell-through rate, stock turn velocity, footfall engagement, and return on display investment (RODI) show whether a POP display drives real business outcomes. Smart brands track, compare, and optimize every rollout.
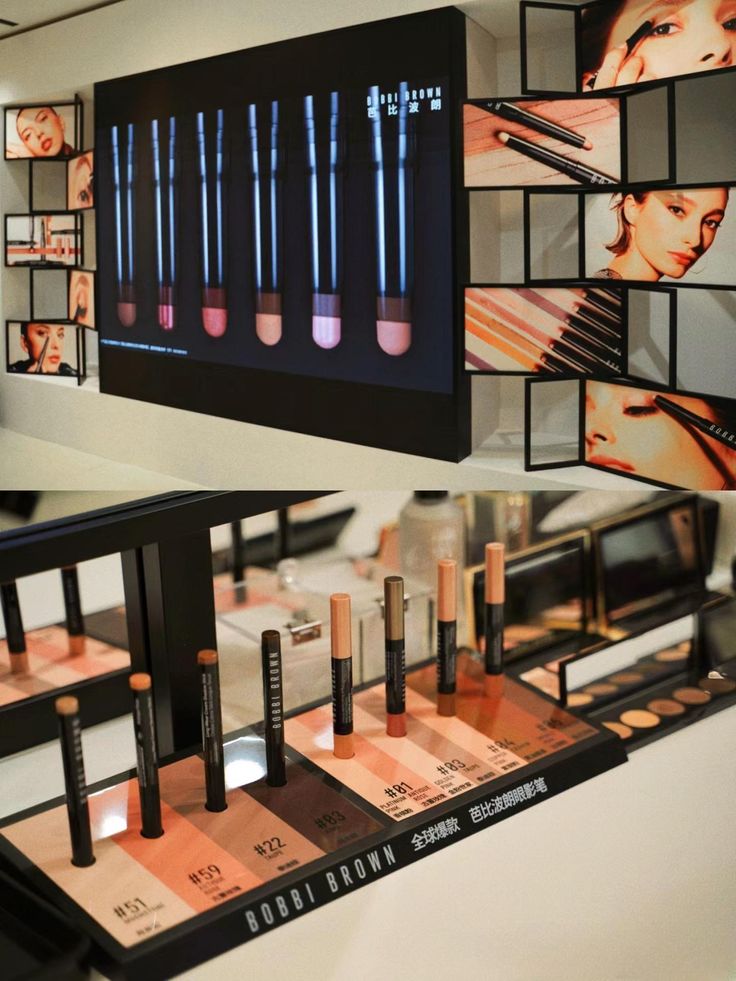
Beautiful displays might win awards — but if they don’t drive results, they won’t get repeated.

“The display looked great, but no one bought the product.”
“We didn’t track what worked better — floor vs. tester.”
“Marketing spent $50K, but we don’t know if it moved stock.”

At Samtop, we help brands connect visual investment to commercial outcome. Below are the 5 performance KPIs you should track to measure (and prove) the ROI of any display rollout.

📊 Why Display KPIs Matter

StakeholderNeeds to Know…
Trade MarketingDid the display convert into uplift?
ProcurementWas the cost justified?
Retailer / ChannelShould this display format be repeated?
Global Brand / HQWhich country or VM type worked best?

🧠 Display ROI isn’t subjective — it’s scoreable.

📈 5 Display Performance Metrics You Must Track

✅ 1. Sell-Through Rate

Formula:
Units Sold ÷ Units Shipped to Store (%)

Why it matters:

  • Shows how fast product moved
  • Especially useful for launches, promos, and LE formats
  • Compare “with display” vs. “no display” stores

🎯 Good Benchmark:
15–25% higher sell-through with display
50%+ sell-through in 4 weeks = strong result

🔁 2. Stock Turn Velocity

Formula:
Units Sold ÷ Average Units Displayed

Why it matters:

  • Reveals speed of product rotation
  • Helps identify SKU over-assortment or underperformance
  • Great for hero SKUs or daily-use items

🎯 Good Benchmark:
2–4 turns/month for hero products
6+ for testers or GWP-focused trays

👣 3. Footfall-to-Engagement Rate

Formula:
# Interactions ÷ Store Footfall (%)

Why it matters:

  • Shows how well your display pulls shoppers in
  • Ideal for tester trays, mirror counters, sampling zones
  • Can be measured by sensors or manual staff tracking

🎯 Good Benchmark:
3–7% footfall engagement = strong in-store attraction

🎯 4. Campaign Execution Score (Display Compliance)

What it is:
A rollout success score based on:

  • Correct setup location
  • All parts attached (header, tester, logo)
  • Product visible and stocked
  • Cleanliness & consistency

🧾 Scoring Tip:
→ Use a 10-point checklist for VM teams
→ Collect photos and audit in real time

💰 5. Return on Display Investment (RODI)

Formula:
Incremental Gross Margin ÷ Display Cost

Why it matters:

  • Shows ROI on visual investment
  • Helps justify scaling or cutting back formats
  • Great KPI for Procurement & CMO alignment

🎯 Good Benchmark:
RODI > 3.0 = high performance
RODI > 1.5 = acceptable for new formats

🧩 Real Use Case: ROI from Lightbox Tester Display

Brand: Premium Haircare
Display: LED Tester Tray
Test: 300 stores A/B format comparison
Results (6 Weeks):

MetricWith DisplayWithout Display
Sell-through Rate36%18%
Footfall Engagement6.2%2.9%
RODI4.6xN/A

Client expanded globally the following quarter.

💬 FAQ

Q: What if I don’t have store-level sales data?
Start by collecting store photos and feedback. Then build in POS and display-specific tracking (e.g., QR scans) in later campaigns.

Q: Can I compare formats like floor vs. tester?
Yes. Use the same KPIs (sell-through, RODI) across formats, ideally in similar-store A/B tests.

Q: Can Samtop help track display performance?
Yes — we build displays with performance tracking in mind: compliance cards, QR codes, store IDs, and photo prompts.


✅ Conclusion: What Gets Measured Gets Reordered

  • ✔️ Define success before you ship the first unit
  • ✔️ Track sales, interaction, compliance — not just design
  • ✔️ Use results to inform your next production run
  • ✔️ Communicate impact to buyers, marketing, and retail teams

🌟 A great display does more than look good — it performs.

📩 Want a Display That Proves ROI?

At Samtop, we:

  • Define KPIs with your team before sampling
  • Integrate tracking elements (QR, store tags, checklists)
  • Build visual compliance kits with photo-based auditing
  • Help brands make performance-based display decisions

📧 Email: [email protected]
🌍 Website: www.samtop.com

Subscribe to our news

Don't miss new updates on your email

Let’s make your concept a reality!

Get an instant quote from our most experienced engineers.
We’d love to hear from you

brochure.pdf

Get Our Latest Projects and Connect with Engineer Bob Chow

Bob Chow Engineer